Money printing or more accurately called credit creation is the driving force behind economic growth and bull markets.
How do we correctly measure money creation?
There are two ways real economy money is created:
- commercial banks make new loans and mortgages
- governments run deficits
Contrary to popular opinion, when central banks pursue quantitative easing (QE) they don’t create real economy money, instead bank reserves are created.
This is an important difference.
Bank reserves never leave the a banks balance sheet and therefore don’t boost economic growth. On the contrary, beefy bank reserves encourage commercial banks to make new loans which creates real economy money.
Banks and governments do the heavy lifting when it comes expanding credit to generate economic growth.
However, when central banks believe the economy is slowing and inflation is not a problem the go-to plan is to run a QE program. In response, banks deal with increased reserves by buying what’s called High Quality Liquid Assets in an attempt to generate higher returns. A risk taking environment is created.
Today central banks are running what’s called quantitative tightening (QT) in response to high inflation. A risk off environment is upon us.
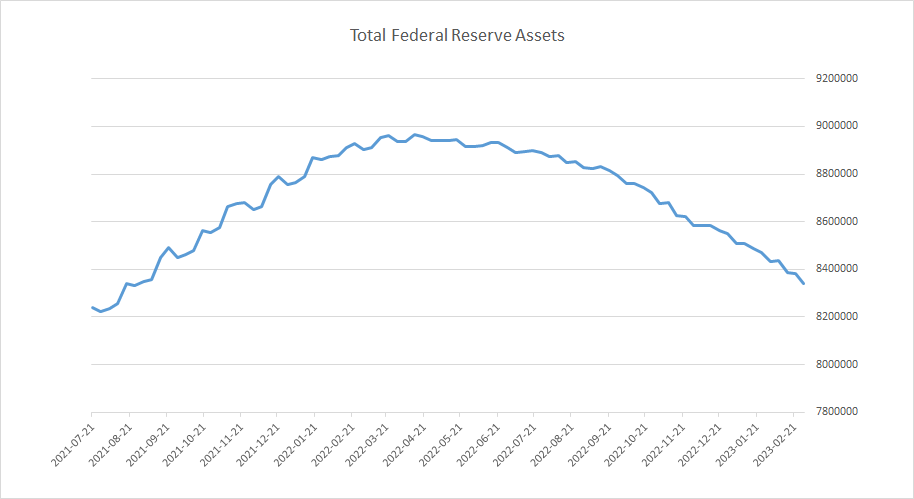
Fortunately, we can easily measure QE/QT by the size of Federal Reserves balance sheet. Below you can see how QT is in fully swing as the curve rolled over Q1-2022.
Quantitative Tightening

Our Quadrant Asset Allocation Model’s vertical axis measures monetary policy stance and the picture looks pretty grim right now. Both real rates and QT are restraining economic growth in an effort to battle inflation.
On the other hand, the models horizontal axis measures forward looking growth indicators, which also kinda look sus at the moment. In January the NAHB index ticked higher along with MoM pending home sales, but housing starts and durable goods stunk. Besides, with the US 30yr mortgage rate at 6.79% it’s not exactly attracting new buyers in droves.
Final thoughts
In summary, the economic landscape is not friendly as growth is scarce and financial conditions continue to tighten up.
This year is proving to be a great example of how actively managing a portfolio can lead to headaches and much frustration. As time passes the more I realize that the passive 60/40 approach to portfolio management is the way to go. Why burden yourself with extra stress and high fees?
Checkout the ETF portfolios. The Passive Portfolio took the lead right out of the gates this year and never looked back.
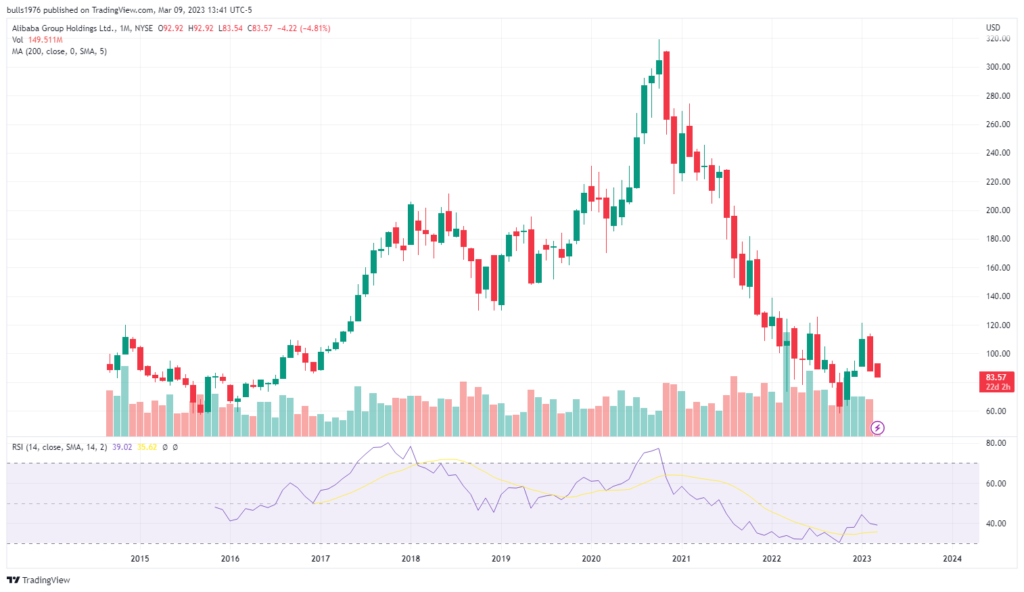
Looking back the BABA buy order timing was lousy. I’m not worried China growth or BABA. The current pull back is understandable considering the stock doubled since October. If things get really out of hand I will add to the position, but for now the RSI is super oversold, so a bounce is possible.

Today the VIX is spicy along with plummeting 10yr yields and stocks, talk about a weird day!
Thanks for reading!
Don’t pass up the opportunity to start a financial plan, if you don’t already have one.
Disclaimer: The content on this webpage is intended for informational and educational purposes only. No content on this webpage is intended as financial advice. The publisher of this website does not take any responsibility for possible financial consequences of any persons using the information in this educational content.
Invest at your own risk. Trade your own view. Do your own due diligence.
