
Today the Apple stock breakout (AAPL: NASDAQ) is hard to miss.
Very rarely does a stock chart look as bullish as Apple’s does today.
No doubt, most people have heard of Apple and know the company makes amazing products. Customer loyalty is undeniable. Better yet, customers will pay up for Apple products. Not to mention the company’s product lines are vast, including the iPhone, Mac, Wearables and services like AppleCare, digital content and payment services.
To be sure, investors have been patiently waiting for the ultimate buying opportunity. That is to say, good things come to those who wait.
In this case, a quick look at the daily and weekly charts is essential.
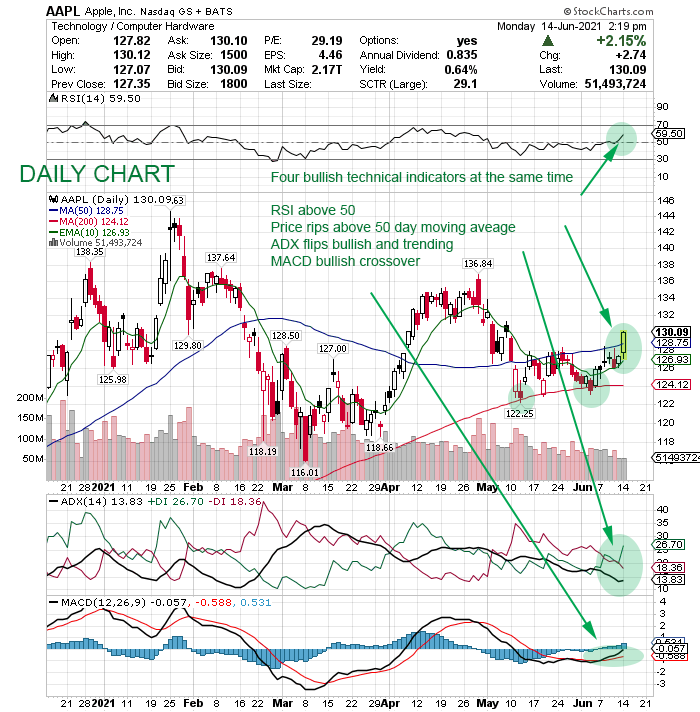
Apple Inc. – Daily Price Chart
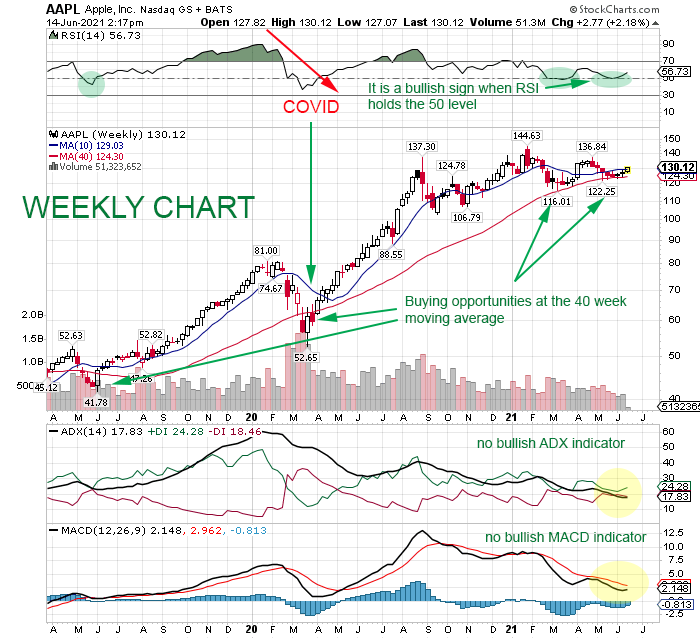
Apple Inc. – Weekly Price Chart
Top 3 Bullish Chart Indicators
- RSI indicators bullish, especially the weekly
- Price trading above all key moving averages (10, 50, 200 daily)
- DI+/ADX signal bullish trend starting
To repeat, the Apple stock breakout looks promising.
Conclusion
By and large, these days it’s hard to find stocks at attractive prices or breaking out of consolidation patterns. At this time Apple stock price looks attractive. Its technical indicators favor a bullish position. Surely, savvy investor’s are buying Apple stock hand over fist today. Are you?
Be sure to check out the Ultimate Portfolio + page. Here you will find all the great companies that are making investors big money.
DISCLAIMER: Content provided in this article is for informational and entertainment purposes only. This article is not legal and/or investment advice. This article should not replace professional investment advice based upon your particular situation. Duties are not assumed, intended or created by this communication.
© 2021 mikehoganonline.com, All Rights Reserved