
Bitcoin chart turns bullish as 3-month consolidation phase comes to an end.
Undeniably, Bitcoin is on of the biggest technological innovations to date. Without doubt, investors and innovators will take blockchain to places unknown. The best part is everyone can get in, and it’s still early.
To be sure, you want to due your due diligence when it comes to how you buy Bitcoin, or any cryptos for that matter. To rephrase it, make sure you cover your ass.
Back to business.
From a technical analysis point of view the daily chart is very bullish. In fact, I’d expect a run to $47,500 and $50,000 very likely in the short-term.
In order to keep the bull run going, buyers need to hold any correction above the previous high, namely the $42,600 level. So, the bulls better dig in the heels at this support level.
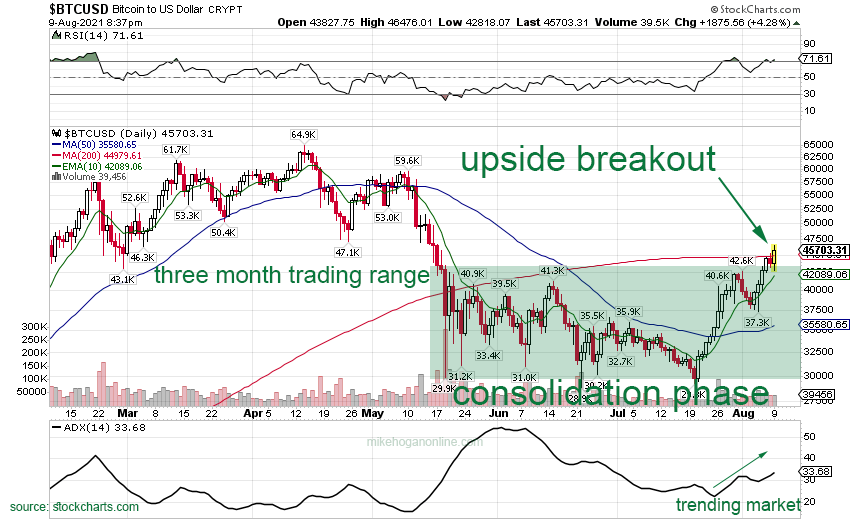
Technical Analysis Highlights
- ADX is rising, meaning a trend is underway
- RSI is above 50, a positive sign
- Recapture of the 200 day moving average, good news!
Conclusion
All things considered, bitcoin prices appear to be heading higher, much higher. For the purpose of maximizing profits, todays’ technical setup and bullish chart is a good point to enter buy orders or add to existing long positions.
All markets come with volatility, with this in mind expect a correction to test prior support.
Here’s an article from last week about how the bulls had yet to stage a bitcoin breakout. Well, that was last week. This week we have a all out bullish move in the market.
On a closing note, if you’re thinking of shorting bitcoin, please lie down until the feeling goes away.