Today I wanted to share with you an example of stop loss hunting. Why should you care? Well, for one thing, its a great way use technical analysis to your advantage. Not to mention the opportunity to:
- get in early on a new trend
- increase profits
- become more confident
- make more money
Fortunately for us, hedge funds love use the stop loss hunting strategy. It’s a classic way to blow out the stops when the situation arises. To be sure, big money Wall Street hedge funds do this all the time. So, be on the lookout.
For example, today Nvidia clearly illustrates this chart pattern.
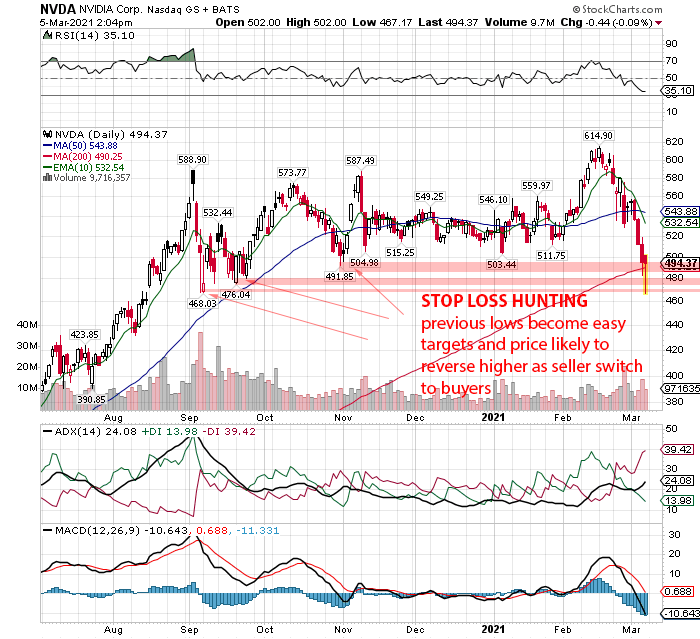
If you have been patiently waiting to buy shares of Nvidia on the cheap – now is your opportunity!
Conclusion
No doubt buying shares on weakness is a good idea as long as you do it right. And technical analysis can make you money if you know what pattern to look for. What’s more is the stop loss hunting pattern is easy to spot.
To sum it up, Nvidia looks attractive at $500. The stop orders have been blown out. Mission accomplished! Now it’s time to get long.
Keep in mind we’re in a correction, so ease into your positions. And be smart – never buy all at once.
DISCLAIMER: Content provided in this article is for informational and entertainment purposes only. This article is not legal and/or investment advice. This article should not replace professional investment advice based upon your particular situation. Duties are not assumed, intended or created by this communication.
© 2021 mikehoganonline.com, All Rights Reserved