
A couple days ago I highlighted the apparent weakness in gold prices. If you missed the post you can view it here.
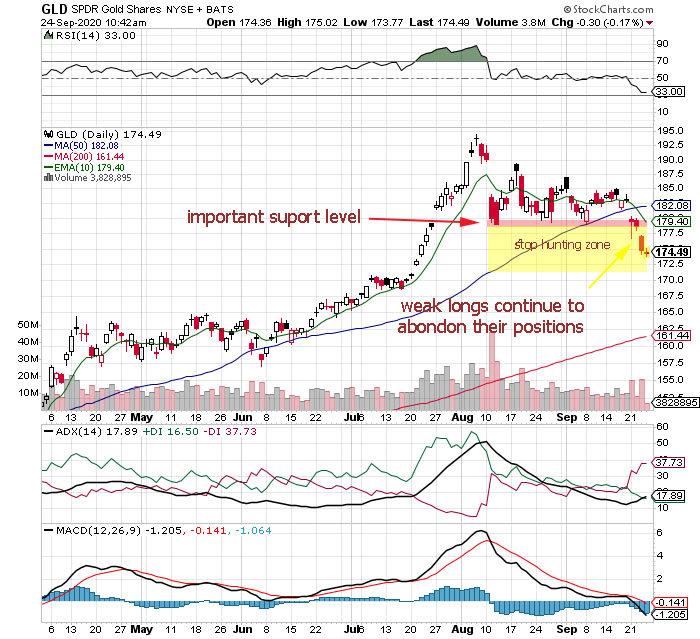
The key support level gold bulls were hoping would hold collapsed yesterday along with equity prices. Rarely do you see gold prices fall in tandem with equity prices. That’s what makes this sell off in gold prices interesting. It seems to me opportunistic shorts took advantage of the weakness in equity prices to hammer gold and trip the stop-loss orders setup just below the support level.
It appears this is another classic example of stop hunting. Stop hunting is a trading strategy employed by hedge funds and other big institutional investors where technical support levels are specifically targeted in an attempt to force weak investors into selling long positions (or buying back short positions). Stop hunting is legal and takes a tremendous amount of capital to execute properly. Nevertheless, it would be a good idea for investors to pay attention to the charts because it is easy to spot possible stop hunting situations.
Take a look at the gold chart below. Notice the gap between support levels. This is where all the stop loss orders are likely to have been placed by naïve investors.
Conclusion
You can use stop hunting to your advantage when adding to or initiating a position in any stock. Simply look for an extended support level either on the downside or the upside. Be patient and see how prices react at those levels. If the support level fails like in gold prices this week, the time may be at hand to take advantage of the opportunity. As for gold prices, the GLD looks to be headed to the $170 level. For those who spotted the stop hunting technical setup, you could have gained a 6% advantage so far.