What a change the month of January has made as risk assets get bid up to start the year. But, is the rally sustainable? Let’s take a quick look at leading economic indicators and where monetary policy stands.
To be sure, markets are looking at two narratives when it comes to risky assets. First is the “soft landing” narrative which has captured to imagination of almost everybody as investor’s pin their hopes on massive rate cuts from the Fed later this year followed by a quick economic rebound. Second is the “hard landing” narrative which basically means were in for a textbook recession sometime during 2023.
The data points to one conclusion. Recession later this year. But will the recession be mild or harsh, that’s an important question? Let’s see where things stand right now.
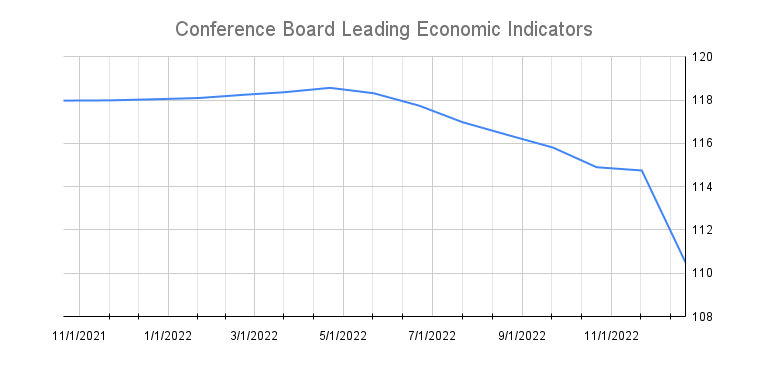
Conference Board Leading Indicators – steep decline
The go-to leading economic indicator continues to decline and makes it tough to get bulled up on risk assets. After all, the conference board LEI has a 100% hit rate when calling recessions. Why very few follow this indicator and respect it is beyond me.
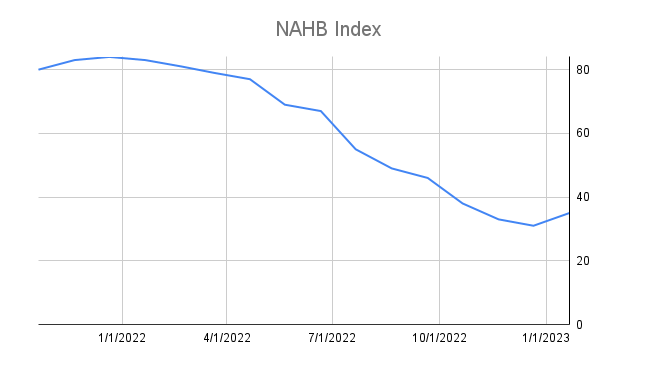
National Homebuilders Index – looking better

December saw an uptick in the US housing index after months of decline. One bright light in an otherwise dreary set of economic conditions. The housing market drives the economy, so seeing December’s uptick is a welcome sign, but does it warrant a ~5% S&P rally? I think not.
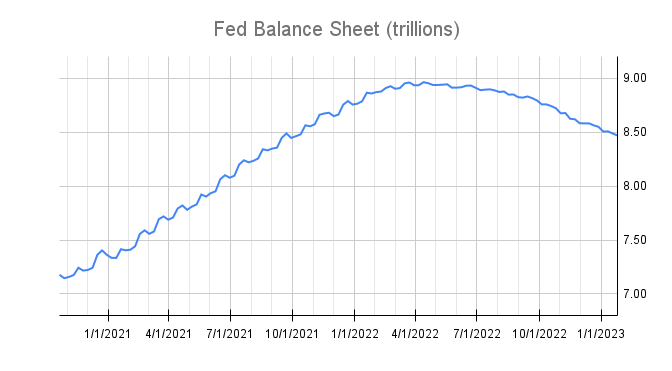
Federal Reserve Balance Sheet Size – things are tightening up

The Fed’s balance sheet continues to decline in size and maturing bonds are not rolled over and new purchases are off the table. Quantitative tightening as measured by the Fed’s balance sheet is expected to continue, not good for liquidity and risk assets.
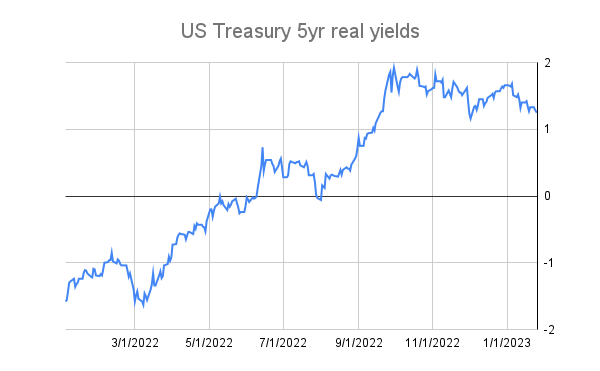
US Treasury 5yr real rates – restrictive territory

My view is that 5yr index gov’t bonds need to be around 0% to provide enough liquidity to encourage risk taking. Any rate above 0% is restrictive and makes it tough for risk assets to rally.
Final Thoughts
January 2023 turned out to to be and exceptional month for risk assets with the S&P 500 rallying ~4.7%. In my opinion, this is a gift to start the year. As outlined above, besides the NAHB index, leading economic indicators point to tough economic conditions for both businesses and households. Furthermore, monetary policy is as tight as a pair of Lululemon leggings, which is good for yoga but bad for the economy.
By the way, did you see Microsoft miss earnings on Jan 24th. Not good. How will the rest of tech report this week?
Bottom line, the rally in risk assets to start the year probably won’t last. A defensive asset allocation seems like the right move until Q1 earnings season is in the rearview mirror. At the very least deploying enhanced risk management measures seems like a good idea.
Thanks for reading!
Are you looking to start a financial plan, then checkout this post.
Disclaimer: The content on this webpage is intended for informational and educational purposes only. No content on this webpage is intended as financial advice. The publisher of this website does not take any responsibility for possible financial consequences of any persons using the information in this educational content.
Invest at your own risk. Trade your own view. Do your own due diligence.
