
Can stocks bounce here after sellers pounded the S&P 500 index for 5 weeks in a row?
This is the question I’m asking myself right now. It’s never a good idea to get entrenched into a linear way of thinking. Investing requires a flexible mindset and it’s extraordinarily hard to do so.
Current Views
Global markets are facing multiple cross currents as rates rip higher and stocks face relentless selling.
Stepping back and assessing the global macro scene is a good idea here (bullet style).
- VIX pops above 30 (fear is palpable, but not epic levels)
- S&P 500 at key support level (3590 – 3640)
- Seasonal S&P 500 bottom around October 9th (turn bullish?)
- Bad macro setup (more tightening, less liquidity)
- Quantitative tightening (QT) in full swing (less liquidity)
- US 10yr note overbought
- Equities oversold
Stocks Seasonality Chart
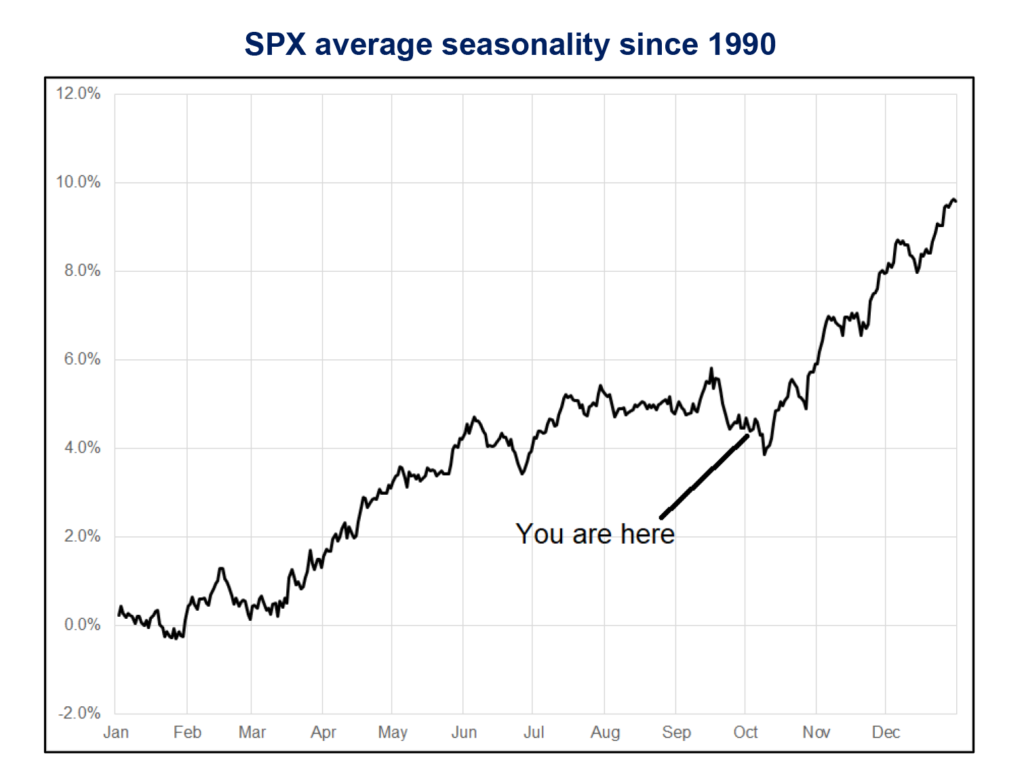
Seasonally stocks typically bottom on October 9th. This is not a fact, just useful information when fine tuning entry and exits points.
Stocks at key support level (SPY)
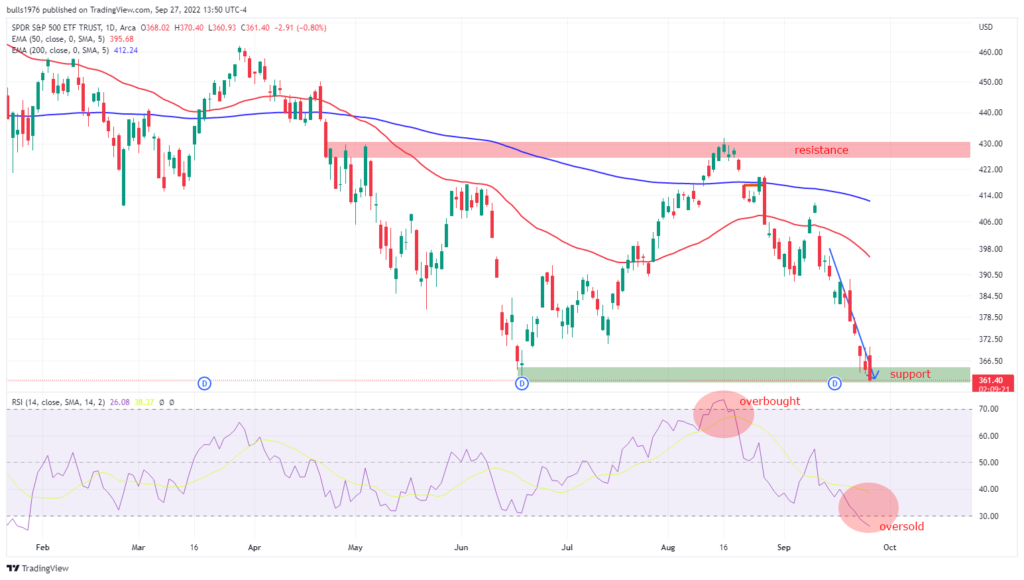
The technical are screaming stocks should bottom here, see above.
My instincts tell me to be long stocks here, but the macro setup looks dreadful. However, this is the first time in a while I’ve had any inkling to buy stocks, if only for technical reasons. If rates can back off and take a breather, stocks have a good chance to rally. Not an epic rally, but tacking on +5% is possible.
But, US 10yr yields are ripping higher, see below.
10 yr US Note Yields
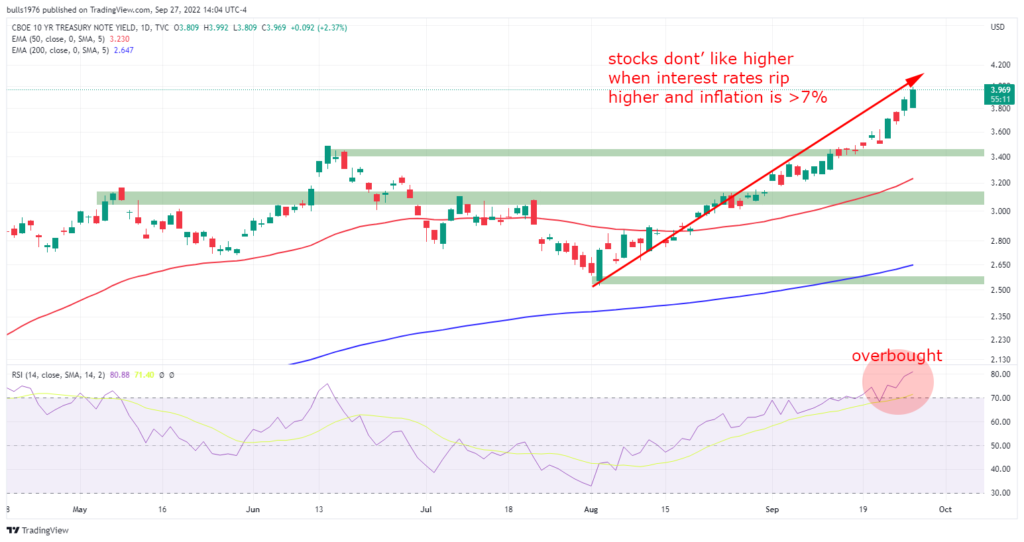
The charts above hint that a pull back in yields and a bounce for stocks is likely in the next couple of weeks. Treasury yields will likely lead this dance going forward.
Trade update
The last Alpha Dawg update outlined my view on stocks and how a short position looked juicy. You can find the post here.
Here’s the trade summary, “I’m short the S&P 500 index via SDS (Proshares Ultrashort S&P 500 ETF) at $49.59 with a stop loss at 48.10 and a take profit at $52. Risking $600 to make $1000 over 5 days. Reassess on September 29th the day before core PCE.”
Yesterday the SDS $52 target was hit, and as any seasoned trader knows, you stick to a sound risk management framework, or face the dreaded risk or ruin.
To recap, the trade was a success earning $1,000 profit over 3 days. Not bad, but not the greatest either.
At the moment I’m flat and free from bias, so I’m open to the new ideas at this point. Taking a tactical long position might be a good trade idea, but first do the due diligence.
Conclusion
To recap, the technicals hint that a pull back in yields and a bounce for stocks is likely in the next couple of weeks.
If interest rates can back off just a tad, stocks can stage a rally. Nothing epic, but being short stocks here doesn’t make a whole lot of sense to me.
I can sum up the entire market in one sentence. As rates move higher stocks move lower. But that dynamic can and does change!
The short-term view remains highly technical and a trader’s paradise.
Long-term passive investors care less about short-term fluctuations like what I’m describing here. They play the long game, stay diversified, and pay rock bottom fees. Better yet, long-term investors can take advantage of shifts in market dynamics without pulling their hair out! Learn how here.
Disclaimer: The content on this webpage is intended for informational and educational purposes only. No content on this webpage is intended as financial advice. The publisher of this website does not take any responsibility for possible financial consequences of any persons using the information in this educational content.
Invest at your own risk. Trade your own view. Do your own due diligence.