
It’s been a while since I posted a market update. So, without delay here is your global macro setup as we approach mid-February.
To summarize, we have a bit of a tricky setup at the moment. First off, global Central Banks are trying to pivot to a tightening monetary policy without upsetting the apple cart. In the face of raging inflation, our monetary master’s appear in no hurry to raise rates. In fact, the snail pace is leaving many seasoned traders dialing back risk until a clearer picture emerges.
It might be wise for us all to step back and assess our equity risk and perhaps take some defensive action.
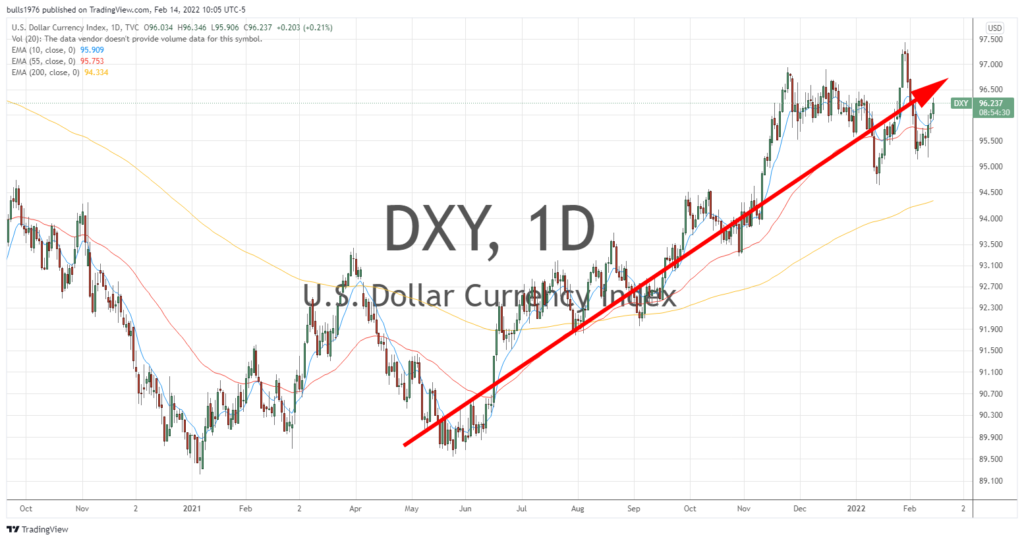
US Dollar – DXY
Clearly, there is no shortage of demand for US dollars. US capital markets remain the deepest and most liquid in the world. Indeed, all the liquidity created by quantitative easing needs to find a home. And the best looking house on the block is US equities.
US Bond Market – US 10-year Treasury Note (Yield)
US rates are on the move higher as the market prepares for rate hikes this March. However, looking back to pre-pandemic levels reveals an interesting dichotomy. Evidently, rates and inflation are out of whack. Today we’re dealing with raging inflation and artificially surprised interest rates. What’s more, if you look back to pre-pandemic levels, during 2018 CPI is ~2% and the 10-year yield is ~3.2%. Today CPI is >7% and the 10-year yield is ~2%. Houston we have a problem!
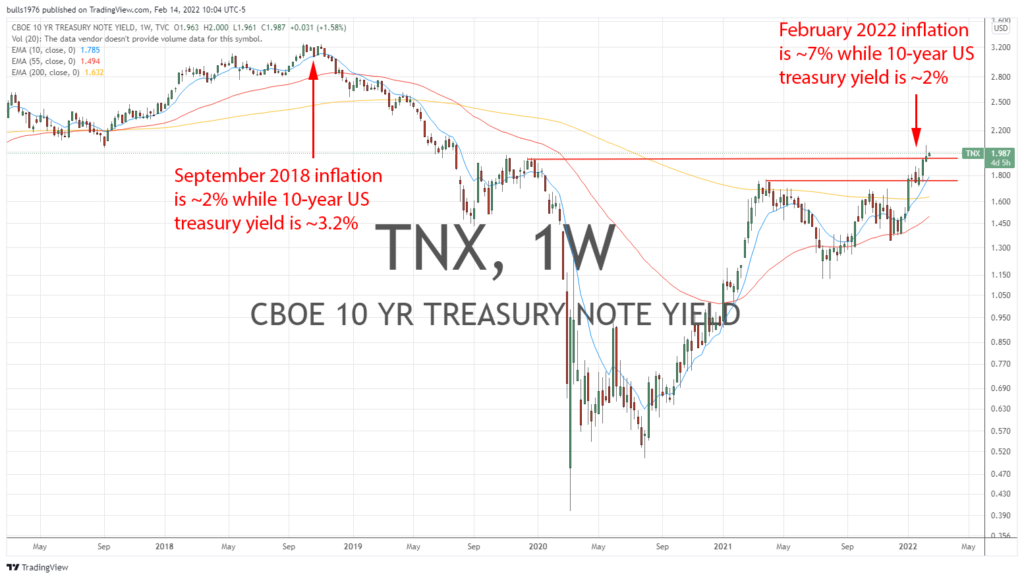
Without a doubt, it’s hard to keep a straight face when explaining yield movements since inflation started “gettin jiggy wit it” this past summer.
Just to be clear ,global Central Banks are WAY behind the inflation curve!
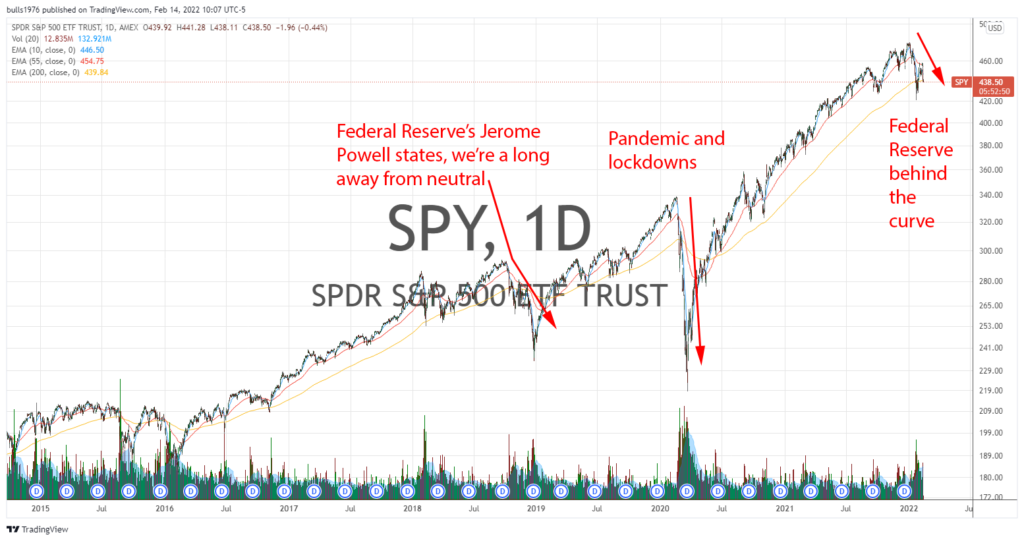
US Stocks – SPY ETF
Meanwhile, stocks continue to march higher even in the face of heightened of volatility. Equity investor’s appear to have not received the message, “rates are going higher.” Or, they have and just don’t care. One thing stands out on the chart, “buy the dip” is still a strategy that works! At least for now.
Conclusion
Clearly, the equity bull market is still in tact, but a few cracks have appeared. Sooner or later the bull market will end. But, until rates rise to a level closely resembling CPI (7%), investor’s only shot to beat inflation on real terms is to tough it out in the stock market.
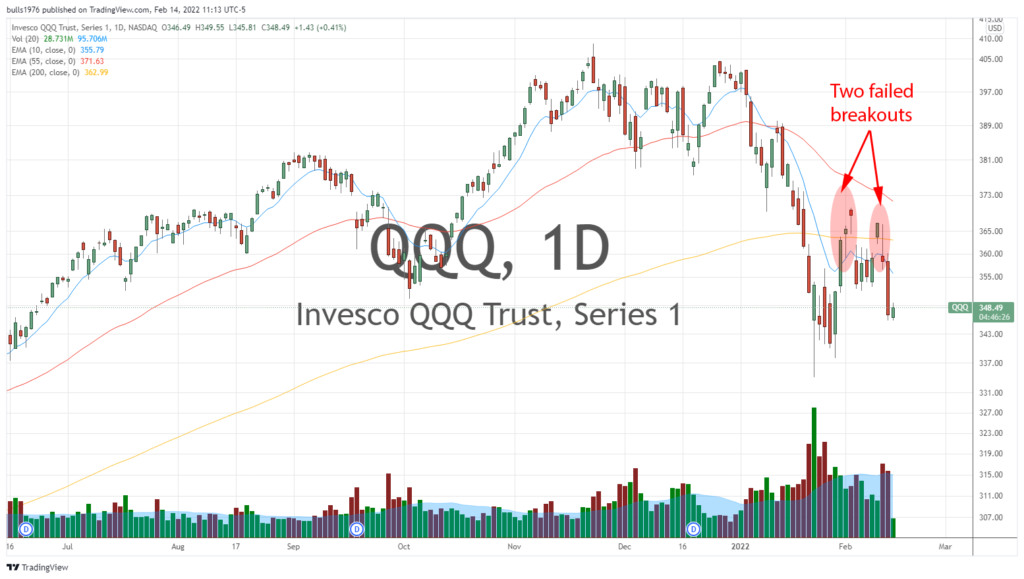
One final note, the NASDAQ 100 tech heavy index has now failed twice to breakout above it’s 200 day moving average. This is a bearish technical setup!
–
What a fear trade looks like –>
–
DISCLAIMER: Content provided in this document is for your informational and entertainment purposes only. This document is not a solicitation for an investment, is not comprehensive, and should not for the basis for any investment decision. This document is not an offer to sell or a solicitation of an offer to buy any securities, commodities, or financial instruments, and my not be relied upon in connection with the purchase and sale of any instruments or interests in investment vehicles. This document should not replace professional investment advice based upon your particular situation. Duties are not assumed, intended or created by this document.
Mikehoganonline (“MHO”) strongly suggests that you obtain independent advice in relation to any investment, and with respect to any financial, legal, tax, accounting or regulatory issues resulting form such an investment. In addition, because this document is only a high-level summary: it does not contain all materials terms pertinent to an investment decision. This document should not form the basis for any investment decision. Information contained in this document has been obtained from sources that MHO believes to be reliable, however MHO make no assurance or guarantee that such information is true and/or accurate, and MHO expressly disclaims liability arising form the use of information contained herein.
This document contains statements of opinion. These statements of opinion include, but are not limited to, MHO’s analysis and views with respect to: digital assets, projected inflation, macroeconomic policy, the market adoption of digital assets (including Bitcoin and Ethereum, and Blockchain), technical and fundamental analysis, financial planning, and the market in general. Statements of opinion herein have been formulated using MHO’s experience, research, and/or analysis, however, such statements also contain elements of subjectivity and are often subjective in nature. In addition, when conducting the analyses on which it bases statements of opinion, MHO has incorporated assumptions, which in some cases may prove to be inaccurate in the future, including in certain material aspects. These analyses and opinions contained herein may be based on assumptions that if altered can change the analyses or opinions expressed. Nothing in this documents represents a guarantee of any future outcome, or any representation or warranty as to future performance of any financial instruments, credit, currency rate, digital currency or other market or economic measure. Information provided reflects MHO’s views as of the date of this document and are subject to change without notice. MHO is under no obligation to update this document, notify any recipients, or re-publish the content contained herein in the event that nay factual assertions, assumptions, forward-looking statements, or opinions are subsequently shown to be inaccurate.
© 2022 mikehoganonline.com, All Rights Reserved